The property cycle is one of the most fundamental things to understand when investing in property. It’s such a powerful concept to understand and provides the reason why property prices go up in the long run. One of the key takeaways is that it’s never a smooth, steady appreciation of prices. Crashes are inevitable, and so are sharp increases.
WHAT CAUSES A HOUSING MARKET CYCLE?
The amazing thing about land, and ultimately property, is that the supply and demand forces are slightly different in other markets.
When discussing land, the amount is finite and set, so you’re unable to create more land. Some cities around the world are willing to reclaim land from the sea. This is not a simple, cost-effective, or long-term resolution to supply imbalances. Furthermore, property can serve as a proxy for land to cater for certain demand requirements. Although strict planning constraints somewhat restrict this, when compared to other types of markets, there is significant demand. The nature of the market enables more businesses to start up to provide the supply, such as supermarkets or launderettes.
Effects Of Supply And Demand On The Property Cycle
As a result, when the economy is growing, demand for land and property increases. Whether that’s for residential homes, warehouses, or office buildings. This extra demand pushes prices up faster than wages and general inflation data.
In this environment, prices are moving quickly, and people are confident that this is the best return available. Property as a proxy for land is in the news regularly, and the assumption is that the price will continue to grow.
As prices are moving significantly faster than wages, a disparity starts to show, and property starts to become unaffordable to the general population.
When this starts to happen, the bust is not far away. Property prices plummet, causing chaos for banks that have lent at inflated values. Banks become more risk-averse and reduce lending options; developers are under pressure, and development tends to stop, which has obvious knock-on effects on businesses and employment levels.
Eventually, affordability drops back in line, and the cycle starts again. Although the key point to note is that the bottom of the market is always higher than the last cycle, in the long-term, property prices have always gone up.
HOW LONG IS EACH PROPERTY CYCLE?
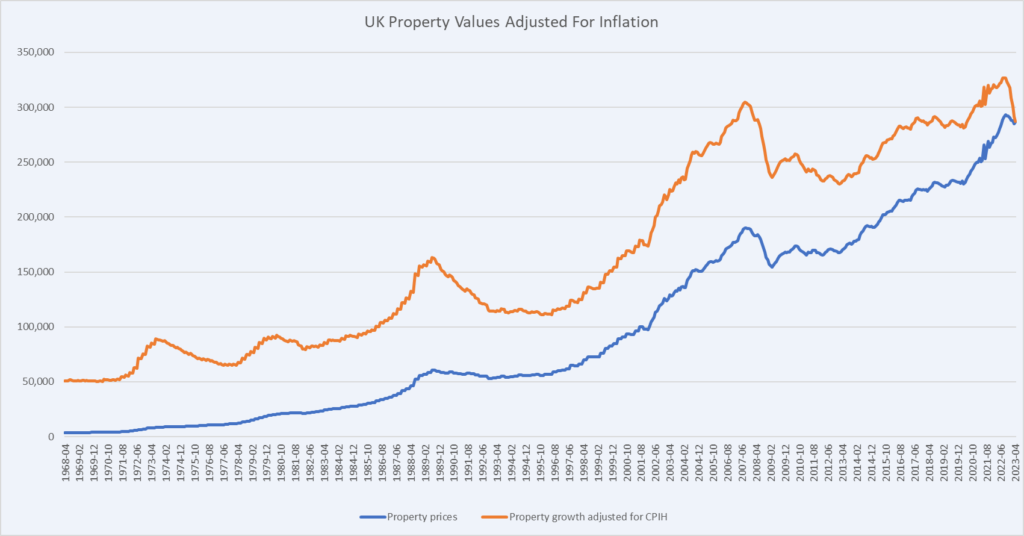
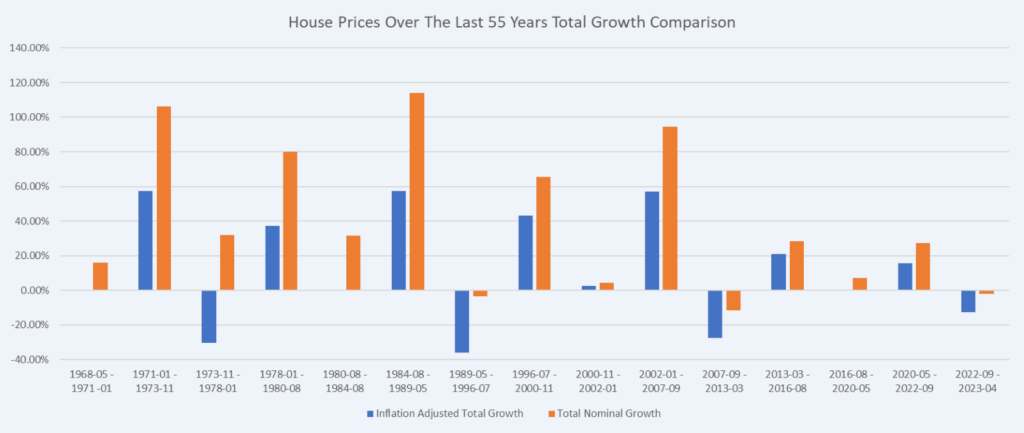
Extensive research is available on this subject. Fred Harrison was the first person to highlight the property cycle. He established that over 300 years of research, on average, each cycle lasted 18 years. This pattern was only interrupted during the 1st and 2nd world wars. He has articulated this research in the books The Power of Land and Boom Bust: House Prices, Banking, and the Depression of 2010. The graph below plots property values for the previous 55 years. The market cycles are less obvious on the total property values, although if you adjust these values for inflation, it shows a very pronounced pattern of the last few property cycles. Furthermore, the cyclical 18-year period that the last two cycles from 1978–1996 and 1996–2013 have largely stayed in line with.
WHAT IS THE 18-YEAR PROPERTY CYCLE?
Fred Harrison identified that throughout each 18-year cycle, there are different stages that repeat themselves with each cycle.
Stage 1 – Recovery
This starts at the bottom of the market. This is where the bravest and most experienced investors start reentering the market. This is where property yields are at their most attractive because prices have dropped significantly, although rents tend to stay stable. In reality, these investors getting into the market at this time don’t know this is the bottom of the market; they are just willing to take more of a risk than others, as it’s a buyer’s market.
People selling at this time either need to sell or believe the property market is over forever. Later on in the recovery stage, larger institutions start re-entering the market once they are confident that prices have hit their lowest point and signs of growth are there. Quality stock is very attractive at this point in the cycle as it is affordable. As the 18-year cycle goes on, attractive areas start to be out of reach for purchases. Therefore, the ripple effect makes second- and third-rate areas more appealing to buyers.
Stage 2 – Mid cycle wobble
The middle cycle dip is strange to explain. There tends to be an event that occurs that creates a slight wobble or stagnation in the market. This happened with the early 80’s recession, the .com stock market crash in the early 2000s, and the Brexit/early COVID-19 in recent times. This combination of economic uncertainty and the memory of the previous crash is still fresh in people’s minds, and it’s tentative that it’s all going to happen again. Moreover, early investors are likely to cash in their gains from buying early. This creates a slight slowdown in the market for a few years.
Stage 3 – Aggressive growth
After a period of indecision within the market, aggressive growth is the next stage of the cycle. At this stage, banks are looking to lend as much as possible to get their share of the returns. Obtaining mortgages is easier due to certain stress test criteria being lower due to confidence in the strength of the market.
Large government and private sector developments and infrastructure projects commonly get approved at this stage, and cranes start appearing across the skyline. In this stage, you commonly start to see more open house viewings with offers in excess of asking, and the balance moves to being a seller’s market. You start seeing the property market in the headlines of the media, which is commonly when logic and fundamentals fall out of the market.
This is the end stage of the upturn in the market known as the winner’s curse. People getting in at this point in the market will find themselves paying significantly more than what the property will be worth in a couple of years’ time. People will say it’s different this time, but it just means all rationalisation is lost and the recession isn’t far away.
Stage 4 – Recession
In the previous years, the market had been driven by confidence and sentiment, not fundamentals. As soon as confidence and sentiment drop, the market plummets. Banks lose confidence, and products start to get pulled from the market. People who are highly leveraged and have fallen into negative equity or who have lost their job and struggle to pay the mortgage trigger waves of forced selling. This continues for a number of years until prices reach a sustainable level. This is when the experienced investors start entering the market again to take advantage of this forced selling, and so the cycle starts again.
HOW HAS THE PROPERTY CYCLE PERFORMED DURING EACH STAGE?
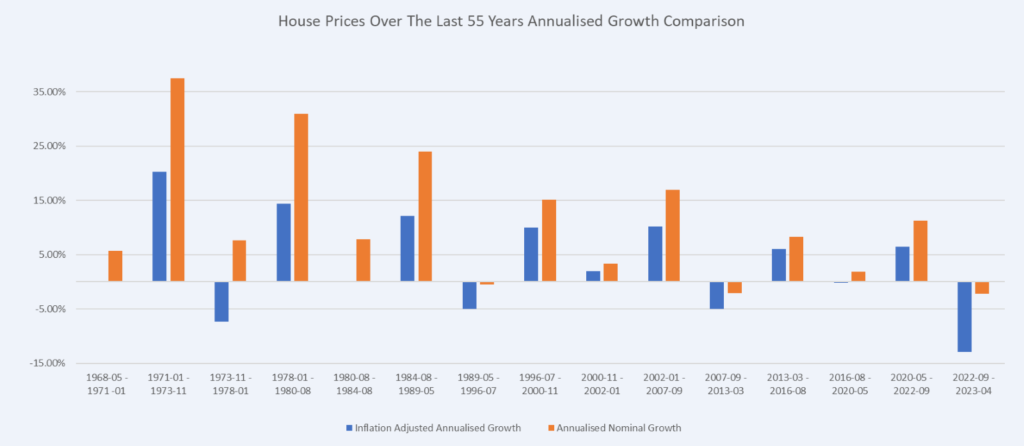
The charts below allow you to understand house price growth during each of the 15 distinct phases of the housing market over the past 55 years.
Annualised growth for each stage of the property cycle
Total growth for each stage of the property cycle
HOW CAN WE TAKE ADVANTAGE OF THE 18-YEAR PROPERTY CYCLE?
Firstly, understand that the 18-year property cycle is an average, not an exact timing, so it can be off a few years either way. It’s not sensible to be fixated on the exact timings; it’s more relevant to understand the market indicators given off by the market for each stage. Once established, you can make the best decisions for the stage of the market.
Stage 1 – Recovery
- High yields on investments
- Widespread pessimism regarding property investment
- Unemployment is high but is starting to reduce.
- Slow increase in values
- Limited bank lending
Stage 2 – Mid-Cycle Dip
- An economic event
- Stagnation of inflation-adjusted prices
- Worry that the recession is coming again.
Stage 3 – Explosion
- Properties are sold through bidding wars and above market offers.
- Media is buoyant over property as an investment.
- Competitive bank lending
- Large, ambitious projects get approved such as the next largest shopping centre or tallest building.
- Low yields for investments
- Prices vastly out pace wage growth
- Unemployment is reducing to low levels.
Stage 4 – Recession
- Values reduce drastically.
- Unemployment increases
- Yields increase
- Forced disposals
- Media reporting financial horror stories
The Correlation Between House Prices and Unemployment
The following shows the relationship between inflation-adjusted property price growth and unemployment rates. As the property market moves into the recessionary stage, unemployment starts to increase dramatically as a result.
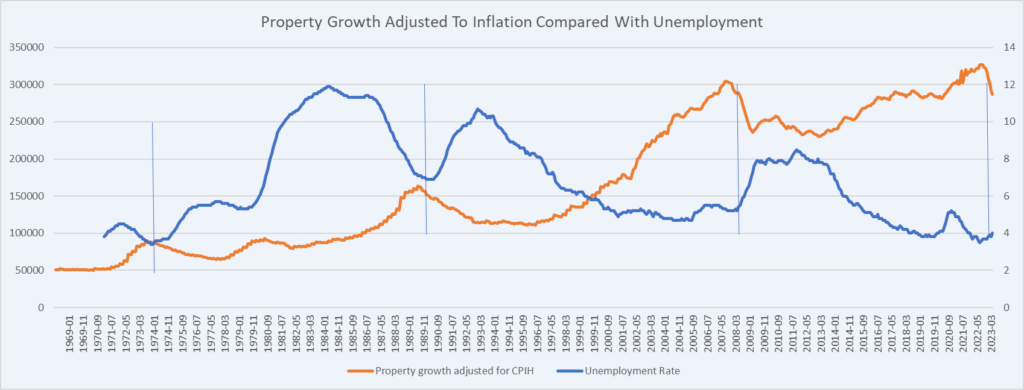
Understanding the stages and the likely next steps for the property cycle will help you make informed investment decisions. This will help you buy low and sell high instead of the exact opposite, which is what the vast majority of people do.
WHAT STAGE IS THE PROPERTY CYCLE IN?
Prices have fallen due to the rapid interest rate hikes made recently to combat inflation. There is an interesting period coming up as mortgage rates have stopped rising and have plateaued for some time now.
Considering the long-term average interest rates, the level they are at now is roughly average with the long-term trend. In other words, interest rates are not wildly high; they have just increased rapidly from a level that people were used to.
Furthermore, unemployment rates are the lowest they have been in 50 years, which shows there is income to service the debt increases that households are experiencing. Although there have been slight increases in unemployment since the start of 2023. Looking forward, after two key elections in the UK and US. This commonly have a significant influence on the property market.
According to the 18-year property cycle, the explosive phase should continue until 2026 if following the 18-year rule, which suggests there should be a couple more years left of explosive growth. At which point should the recessionary period start.
SUMMARY
Considering that interest rates are stabilising and unemployment rates are at all-time lows, there is an argument that the property market could ignite the winner’s curse leading up to 2026. This would align with the long-term 18-year cycle.
On the other hand, with the changes already made by the Labour party since coming to power has dampened investor sentiment. The 18-year cycle is not exact and has been short before. The next 6–12 months will be an interesting indicator of whether we should be deploying cash or sitting tight and disposing of poor-quality assets under the winner’s curse.

