The UK housing affordability issues has been a growing problem for some time. The main issue is house prices soaring while average wages have been unable to keep pace. Therefore, wannabe homeowners are finding it harder and harder to get on the property ladder.
This blog explores the implications of these trends, examining the disparity in house price growth versus wage growth across different regions and what factors are contributing to this ongoing issue.
A definition of the UK house price to earnings ratio
The house price to earnings ratio is a crucial metric for assessing housing affordability in the UK. The housing affordability ratio reflects the relationship between average house prices and average earnings. It provides a gauge into how accessible homeownership is for the average person.
UK Housing affordability ratio calculator
This is calculated on varying scales; it can be done at a country, region, county, or district level. It’s worked out by dividing the annual salary by the average house price, showing the number of years on average it would take to afford a house.
What is the current average house price vs salary in the UK?
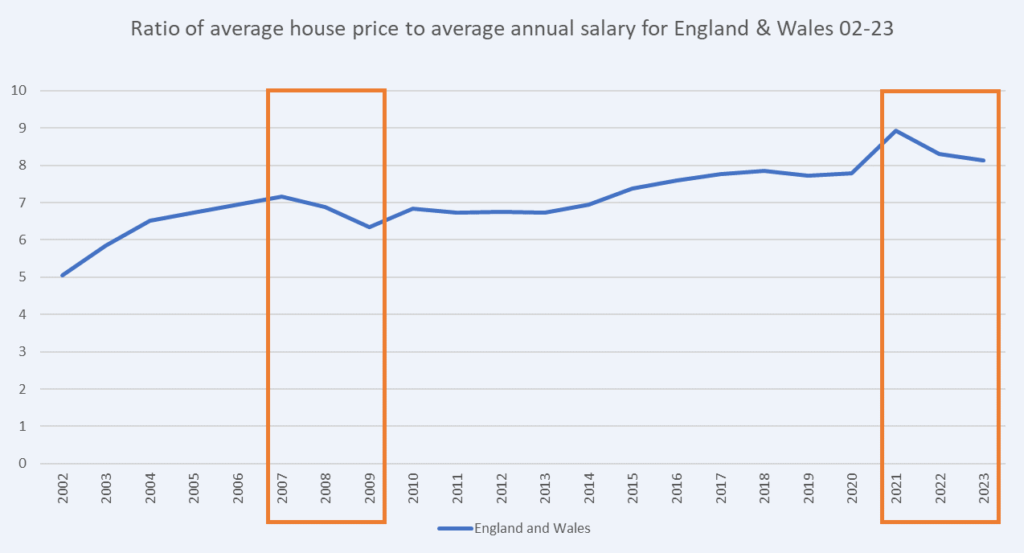
As of 2023, the average house price in the UK stands at approximately £285,000, while the average salary hovers around £35,000. This results in a house price to earnings ratio of about 8.14. In other words, it will take the average person 8.14 years to earn the same amount as an average house.
Has buying a home become less affordable?
How has housing affordability changed in the UK since the turn of the century? House prices in the UK have grown dramatically, outpacing wage growth significantly. In the year 2002, the average house price was around £104,000. Fast forward to 2023, and the average house price is £285,000, with prices rising over 175%. In contrast, average salaries were £20,600 in 2002 and have grown by about 70% to £35,000 by 2023.
So, have UK houses become less affordable over last 20 years?
The answer is a resounding YES. The following graph shows the growth in salary and house prices; you can see the gap getting bigger and bigger.


If we look back over the last 60 years, you can see the disparity between salary and house price grows. Apart from a dip in the 90s where inflation adjusted, house prices stayed stagnant for the decade and salary caught up somewhat.
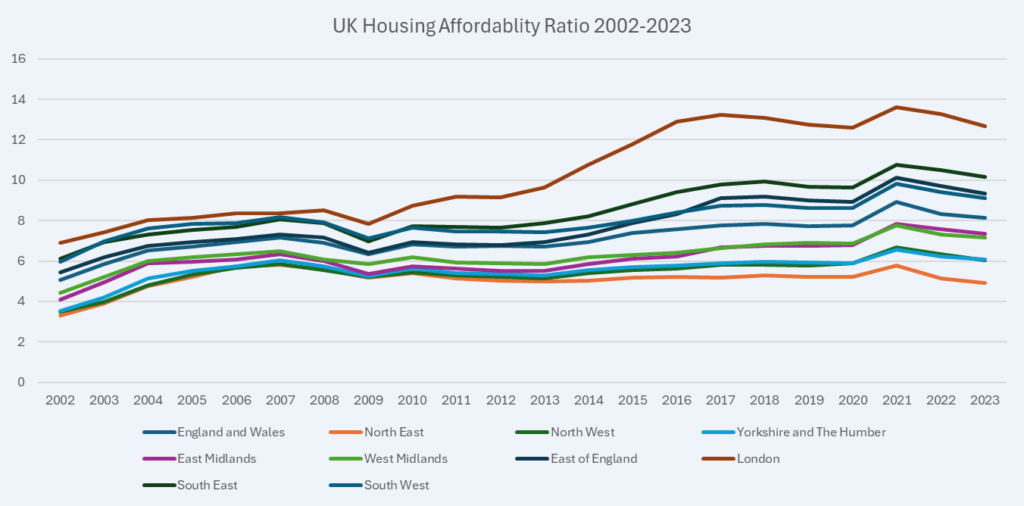
From the 2000s onwards you can see the growth in unaffordability throughout the UK. London being the front runner and being way above 10x average house price to salary since 2013.

Has UK housing affordability improved in recent years?
In short YES – UK housing has become more affordable between 2021-2023. It dropped from a house price to earnings ratio of 9 to 8.14 during the period. This is due to a reduction/plateau of property prices and significant growth in average wages due to inflation. A similar increase in affordability occurred during the financial crisis between 2007 and 2009 before the unaffordability train continued to climb again.

UK housing affordability: The North vs. The South
The disparity in house prices and wage growth is stark when comparing the North and South of England. In the South, particularly in areas like London, house prices have soared, with London’s average house price now exceeding £530,000. Whereas salary is around £42,000, which translates to a house price to earnings ratio of about 12.6 —well above the UK average of 8.14.
In contrast, regions in the Northeast have seen slower house price growth. Although average house prices in the Northeast are around £155,000 and the average salary is about £31,500. This results in a house price to earnings ratio of 4.93.
How does the UK housing affordability ratio differ between local UK authorities?
What is the affordability ratio of lower earnings to lower-priced homes? These tend to be found in the north of England and in some areas of Wales. These will also be where low-priced homes are based.
The 25 most affordable areas in the UK according to the average salary vs. house price ratio.

What are the 25 least affordable areas in the UK according to average wage vs. house price?

To observe the UK’s real house price chart and salary movement over time, you can obtain the data from the ONS.
Why is there a lack of UK housing affordability?
Lack of Supply
One of the primary reasons for the growing affordability issues is the lack of housing supply. Government estimates suggest that the UK needs to build approximately 300,000 new homes annually to meet rising demand.
Although the actual housing construction is some way short of that, at 150,000 to 200,000 homes per year in recent years. This shortfall contributes to the affordability crisis, particularly in high-demand areas. The gap between housing supply and demand continues to widen, placing further strain on the market and ultimately the affordability gap.
Attractiveness of Homeownership
In the UK, there is a strong appeal to owning a home. The notion that “everyone’s home is their castle” drives many to aspire to homeownership. This desire is largely driven because owning property has long been viewed as a symbol of success and stability. Therefore, over 62% of the English population owns their own home.
In contrast, many European countries have a higher percentage of renters. For example, in Germany, renting is widely accepted, with over 53% of the population renting. This cultural difference leads to higher demand for homeownership in the UK, further inflating prices and contributing to the affordability crisis.
Demand from Abroad
The UK housing market experiences a significant number of overseas buyers, particularly in London. This influx of overseas investment can drive prices higher, making it even more challenging for local buyers to afford homes.
The appeal of UK property for foreign investors is because of stability and long-term value. However, this demand influences the local affordability, as homes that could be available to residents are snapped up by overseas buyers.
Regional Differences
Regional differences in price growth highlight the impact of demand on affordability. In London and the Southeast, house prices have experienced explosive growth, while regions in the North have lagged behind as we cover above.
This disparity means different challenges. While house prices in the north may be lower, the average wages in these areas are also lower. This leads to a different kind of affordability issue in London, where salaries are high, but the prices are even higher.
UK housing affordability conclusion
Facing UK housing affordability issues is tricky considering we are only building between 150,000 and 200,000 new homes per year. The fundamental issue is supply and demand. Coupling that with cultural factors, external influences, and regional disparities. Without a substantial increase in housing supply, the affordability gap will likely continue to widen.


