

Is it smarter to rent or to buy in 2023 when looking at the long term? This is the type of question we look to answer with this article and the supplementary Buy vs. Rent spreadsheet. We look at the financial effects a certain decision now will likely have for you in the future. Highlighting the implications certain strategies have on your ability to grow your net worth at a specific rate.
There is no way you can predict the future, although you can forecast. This gives an understanding of the relative merits that each option is likely to present in the future. The financial model attached to this article has considered the current environment and the historic track record of various scenarios. The model helps you understand the pros and cons of buying vs. renting your own home. Moreover, the effect it has on your ability to grow your wealth over the long term. Furthermore, we analyse purchasing your home with different levels of equity and the influence it has on wealth generation.
THE APPROACH
The financial model for Buy vs. Rent looks at the impacts that different scenario portfolios have over a 5- to 25-year time period. By using a lump sum of money and calculating the growth over the two time periods with adaptable market inputs. It doesn’t take into consideration earnings over that period and the ability to save money, month to month, from, say, a job.
The spreadsheet presents comparison charts for the five portfolio scenarios presented below. These charts show the opportunity costs associated with allocating the lump sum in varying amounts to owning your home. Furthermore, the impact has been felt over a 5- to 25 year period of wealth creation. This is not an exact reflection of what your wealth is going to be at that stage. It’s an indication of the likely trajectory of your wealth, depending on the assumptions chosen. The end of this article has a summary of the assumptions, which are adaptable to suit your specific situation.
BUY VS. RENT: PORTFOLIO SCENARIOS ANALYSED
Portfolio 1
Renting your own home. Investing your total wealth in a portfolio allocation of 65% securities and 35% mortgaged rental property
Portfolio 2
25% mortgage on your own residence. The balance of wealth is invested in a portfolio allocation of 65% securities and 35% mortgaged rental property.
Portfolio 3
50% mortgage on your own residence. The balance of wealth is invested in a portfolio allocation of 65% securities and 35% mortgaged rental property.
Portfolio 4
75% mortgage on your owned residence. The balance of wealth is invested in a portfolio allocation of 65% securities and 35% mortgaged rental property.
Portfolio 5
Owning your own residence with cash equal to your total net worth with no funds allocated to an investment portfolio.
BUY vs. RENT LONG-TERM FINANCIAL FORECAST—EXAMPLE SPREADSHEET
PORTFOLIO 1: SUMMARY
The following summary table shows the projected returns for portfolio 1 described above with a starting net worth of £500,000. The following table shows the estimated personal wealth growth over a 5- to 25-year period.
Portfolio 1: Rent and Investment Feasibility Summary
| 5 Year Wealth Gain NPV @ 6.5% | £47,110 | 25 year wealth gain NPV @ 6.5% | £1,619,031 | ||||
| IRR | 8.58% | IRR | 13.12% | ||||
| Home Ownership Net Gain | £- | Home Ownership Net Gain | £- | ||||
| Investment Net Capital Gain | £316,600 | Investment Net Capital Gain | £10,598,363 | ||||
| Rental Income | £59,900 | Net cash flow | £627,495 | ||||
| Total Wealth Growth Over Period | £376,500 | Total Wealth Growth Over Period | £11,225,858 | ||||
PORTFOLIO 5: SUMMARY
The following example shows the projected returns for portfolio 5 described above with a starting net worth of £500,000. There are no mortgage repayments due to ownership in cash and no initial lump sum invested in securities or property. This option provides an additional opportunity to save more each month, as you don’t have a mortgage or rent to pay. The model reflects the added saving/investment bonus that owning your residence in cash creates compared to the other scenarios.
The benefits of no mortgage payments, provide the ability to deploy this cash into your investment portfolio each month. These investments have the same allocation as the other scenarios for consistency of returns.
The following table shows the estimated personal wealth growth over 5 and 25 years of owning your home in cash.
Portfolio 5: Ownership of a home in cash and a yearly savings feasibility summary.
| 5 Year Wealth Gain NPV @ 6.5% | (£37,771) | 25 year wealth gain NPV @ 6.5% | £381,863 | ||||
| IRR | 4.64% | IRR | 9.27% | ||||
| Own Home Net Gain | £13,183 | Home Ownership Net Gain | £379,111 | ||||
| Investment Net Capital Gain | £37,700 | Investment Net Capital Gain | £2,913,945 | ||||
| Rental Income | £7,228 | Net cash flow | £421,072 | ||||
| Total Wealth Growth Over Period | £58,110 | Total Wealth Growth Over Period | £3,714,128 | ||||
BUY vs. RENT: LONG-TERM FINANCIAL FEASIBILITY RESULTS
NPV/IRR COMPARISONS
Net present value (NPV) and internal rate of return (IRR) are standard financial feasibility tests to compare valid options. The following are definitions for both:
NPV meaning: This is the difference between the present value of cash inflows and outflows over a period of time in the future. You use NPVs in investment planning to evaluate and compare the profitability of projects at a desired rate.
IRR meaning: The IRR equals the discount rate that would zero the NPV for a given project. In simpler terms, the IRR indicates the annualised rate of return for a given investment. For example, with property, it combines the rent received and capital growth to establish the investment total return.
The results show that at a discount rate of 6.5%, over 5 years, only portfolio 1 and portfolio 2 provided positive returns. Over 25 years, all scenarios provided a total rate of return above the benchmark. The balance of wealth in investments increases over time as returns compound at a higher rate than your own residence. The following table shows the expected returns from each scenario over the two time periods.
| Categories | Portfolio 1: Renting | Portfolio 2: 25% Deposit | Portfolio 3: 50% Deposit | Portfolio 4: 75% Deposit | Portfolio 5: Cash | ||
| 5 Year NPV @ 6.5% | £47,110 | £3,877 | -£10,006 | -£23,889 | -£37,771 | ||
| 5 Year IRR | 8.58% | 6.68% | 6.03% | 5.35% | 4.64% | ||
| 25-Year NPV @ 6.5% | £1,619,031 | £1,242,919 | £958,617 | £670,240 | £381,863 | ||
| 25-year IRR | 13.12% | 12.25% | 11.50% | 10.54% | 9.27% | ||
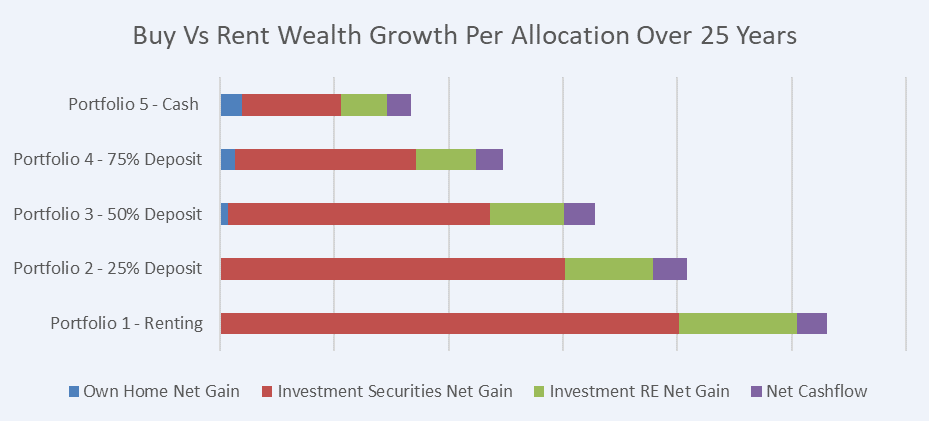
BUY vs. RENT: WEALTH GROWTH BY ALLOCATION OVER 25 YEARS
This graph shows the total wealth generation that each scenario provides over the next 25 years. Moreover, it breaks down the growth into the separate allocations made in each scenario. Over the period, the investment allocations to securities and real estate have influenced total wealth the most. Whereas the growth created by owning your own property was the lowest contributor to wealth creation.
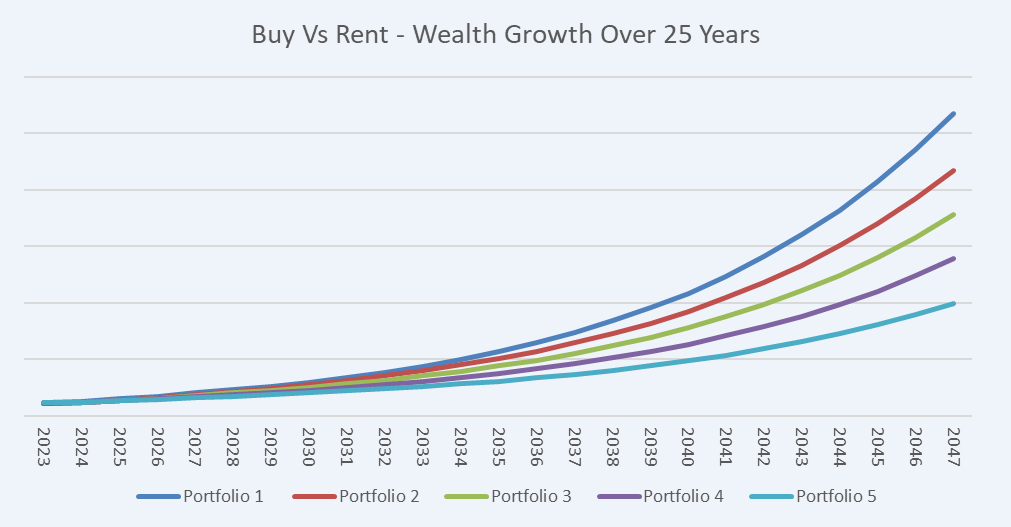
BUY vs. RENT: TOTAL WEALTH VALUE
The following graph shows the effect that compound interest has on your ability to build wealth. Furthermore, it shows the significant differences it creates when compounding at different rates consistently over a long period of time. Investing in high-growth, high-yielding assets instead of owning a home creates profoundly different outcomes for your wealth.
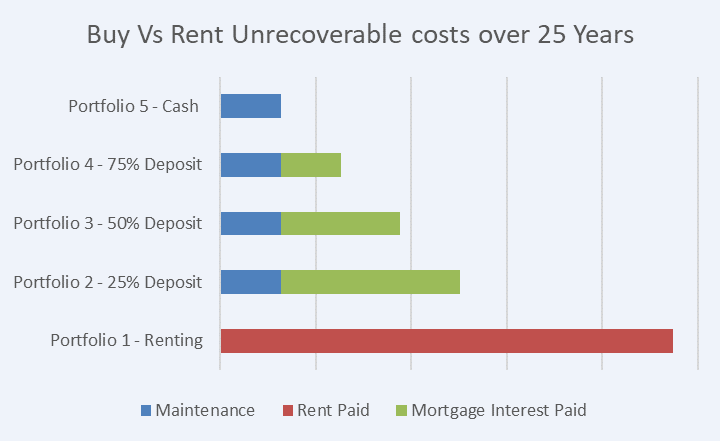
BUY vs. RENT: UNRECOVERABLE COSTS PAID OVER 25 YEARS
The comparison graph below shows the unrecoverable costs that are apparent for the scenarios over a 25 year period. This shows the difference in cash flow required month to month to maintain each scenario over 25 years. Within the financial model, the scenarios with lower unrecoverable costs, invest their monthly savings into the prescribed allocation of 65% of securities and 35% of property. This enables a fair comparison between the scenarios.
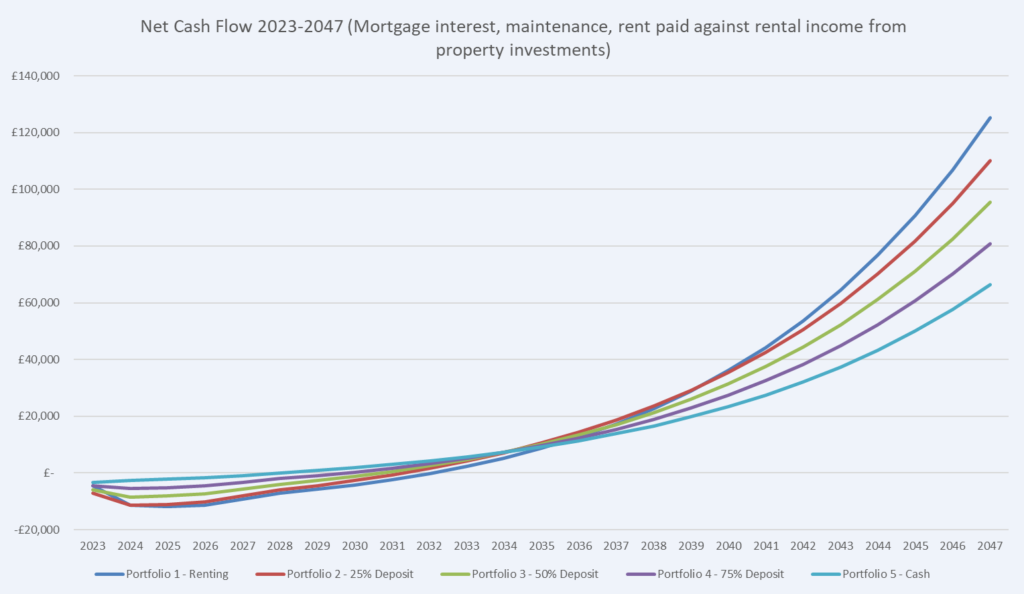
BUY vs. RENT: CASH FLOW COMPARISON
The following shows the net cash flow for all five scenarios. The cash flows are calculated by taking the monthly rental income from real estate investments away from all outgoing unrecoverable costs. As expected, renting your own home provides negative cash flow for the longest period of time. Although it grows the fastest through compounding at a higher rate. Portfolio 5: The cash ownership of your residence provides the fastest option to becoming cash positive due to the low amounts of unrecoverable costs. Although, over the long term, it provides the lowest cash flow growth as less capital is invested.
SUMMARY
When looking at the forecasted results for the 5 different portfolio scenarios, it’s clear that renting and investing your total wealth yields the highest growth for your total wealth. Although you need income from month to month to service the rental demands of your residence. Owning your home in cash and slowly investing the benefits of reduced unrecoverable costs warrants the slowest growth in your total wealth, although you need significantly less income from month to month to service this scenario. The other scenarios provide unrecoverable costs and returns between these two extremes.
The scenario comparisons purely consider financial aspects and are only one aspect of the decision-making criteria. This shouldn’t be the only reason to take a certain path, as there are non-financial aspects to consider. As mentioned previously, there is no one scenario that fits all, and you need to weigh up the various merits and see what suits your personal situation. For example, scenario 1—renting and investing—could suit a young professional who wants to build their wealth in the most efficient way possible, whereas someone looking to work less or retire might suit cash ownership in scenario 5, which enables them to significantly reduce their monthly unrecoverable costs. The decision matrix is a really handy tool to help make a holistic and weighted decision that suits your requirements.
SPREADSHEET TEMPLATE
The individual property comparison shows a detailed drilldown into whether a specific property is worth renting or buying. This spreadsheet shows the wider/long term picture of how buy vs. rent decisions affect you over two periods of time. I find it good to know all the options available and the positives and negatives each warrant in order to make a completely justified and well informed decision about what suits me best. Please click below to download my spreadsheet and tweak it to suit your situation in order to understand the pros and cons for you.
Assumptions
The list of assumptions set out in the supplementary spreadsheet should be modified to financially analyse your personal situation. The basis of the model compares the growth of current wealth from now into the future, taking into consideration the five scenarios. There is no consideration taken for salaries. Although it does take into consideration the opportunity cost presented when reducing your monthly expenses due to deploying more equity into your own home. The yearly savings from a certain scenario are deployed into the investment allocation to create a balanced comparison.
The general assumptions are that the owned residences are just maintained, and there is no assumption that any added value activities were made to increase the asset valuation above normal market rates.
Property growth has followed Savills UK house price predictions for the next 5 years and thereafter is set at the 17-year average provided by the Office of National Statistics.
Taxes for each scenario have been left out of the investments and home purchases, as this is subjective to personal circumstances. Tax has been removed from unrecoverable costs as this feasibility study was based in the UK. In the UK, whoever occupies the property pays, and so both renters and homeowners are required to pay, cancelling each other out.
.